Overview
VinBigData Chest X-ray Abnormalities Detection is an competition thay organized by Vingroup Big Data Institute. In this competition, you’ll automatically localize and classify 14 types of thoracic abnormalities from chest radiographs. You’ll work with a dataset consisting of 18,000 scans that have been annotated by experienced radiologists. You can train your model with 15,000 independently-labeled images and will be evaluated on a test set of 3,000 images
In this article Etrain add “Finding” label with images that contain the abnormalcy. We have a total of 16 classes.
labels = [
    "Aortic enlargement",
    "Atelectasis",
    "Calcification",
    "Cardiomegaly",
    "Consolidation",
    "ILD",
    "Infiltration",
    "Lung Opacity",
    "Nodule/Mass",
    "Other lesion",
    "Pleural effusion",
    "Pleural thickening",
    "Pneumothorax",
    "Pulmonary fibrosis",
    "No finding",
    "Finding"
]
Download data
In this article Etrain use VinBigData Original Image Dataset, it converted DICOM format to JPG format
First you follow this instruction to download and unzip the dataset.
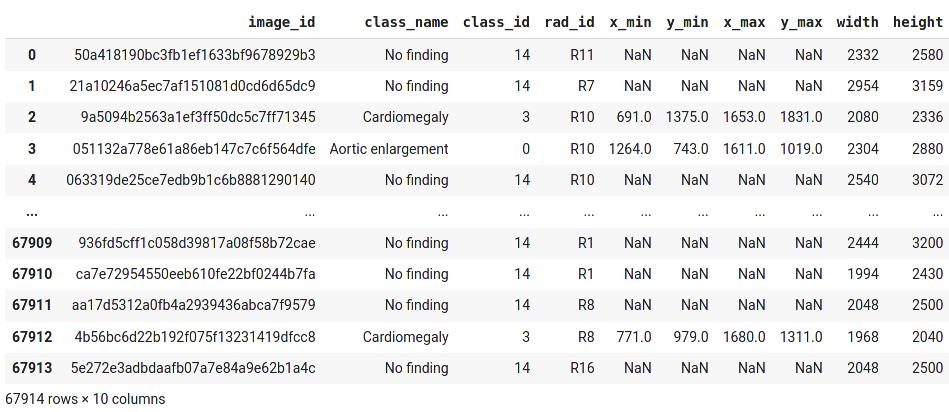
The train.csv file
import pandas as pd
df_train = pd.read_csv('/content/vinbigdata-xray/vinbigdata/train.csv')
df_train
Prepare data for Yolov5
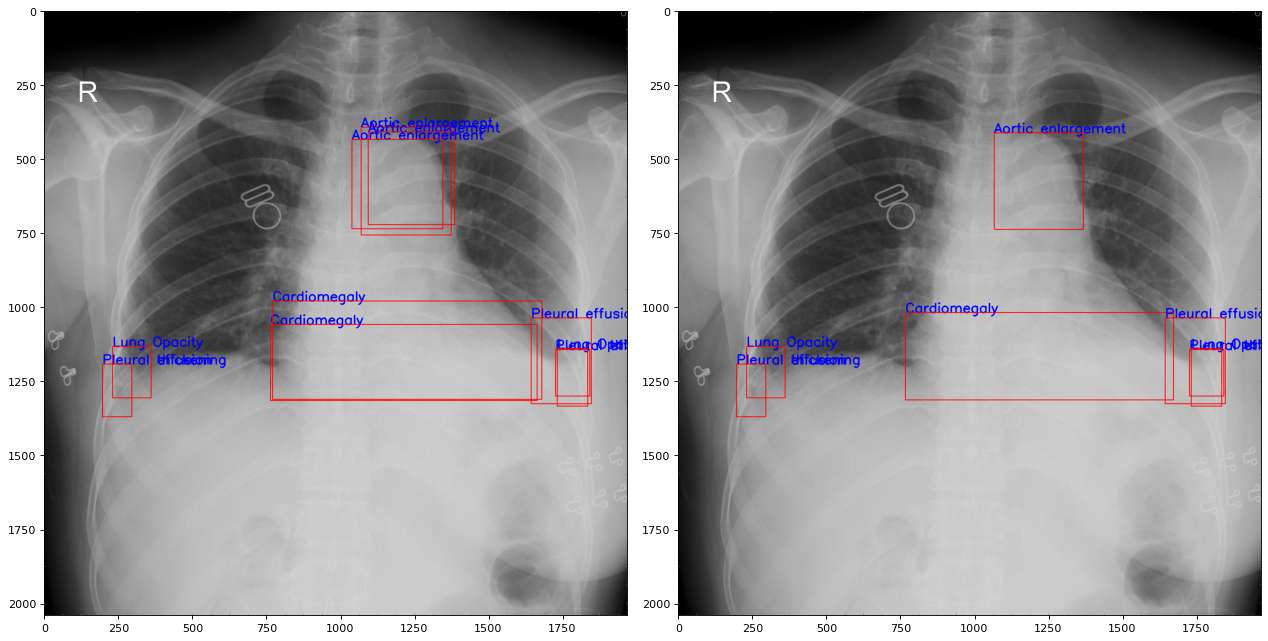
Each abnormalcy can be predicted by many radiologists. We can get the average of the coordinates to reduce overlapping labels
We apply to all images and split data into 16 classes
def bb_iou(boxA, boxB):
# determine the (x, y)-coordinates of the intersection rectangle
xA = max(boxA[0], boxB[0])
yA = max(boxA[1], boxB[1])
xB = min(boxA[2], boxB[2])
yB = min(boxA[3], boxB[3])
# compute the area of intersection rectangle
interArea = max(0, xB - xA + 1) * max(0, yB - yA + 1)
# compute the area of both the prediction and ground-truth
# rectangles
boxAArea = (boxA[2] - boxA[0] + 1) * (boxA[3] - boxA[1] + 1)
boxBArea = (boxB[2] - boxB[0] + 1) * (boxB[3] - boxB[1] + 1)
# compute the intersection over union by taking the intersection
# area and dividing it by the sum of prediction + ground-truth
# areas - the interesection area
iou = interArea / float(boxAArea + boxBArea - interArea)
# return the intersection over union value
return iou
def averageCoordinates(df, threshold):
tmp_df = df.reset_index()
duplicate = {}
for index1, row1 in tmp_df.iterrows():
if index1 < len(tmp_df) - 1:
next_index = index1 + 1
for index2, row2 in tmp_df.loc[next_index:,:].iterrows():
if row1["class_id"] == row2["class_id"]:
boxA = [row1['x_min'], row1['y_min'], row1['x_max'], row1['y_max']]
boxB = [row2['x_min'], row2['y_min'], row2['x_max'], row2['y_max']]
iou = bb_iou(boxA, boxB)
if iou > threshold:
if row1["index"] not in duplicate:
duplicate[row1["index"]] = []
duplicate[row1["index"]].append(row2["index"])
remove_keys = []
for k in duplicate:
for i in duplicate[k]:
if i in duplicate:
for id in duplicate[i]:
if id not in duplicate[k]:
duplicate[k].append(id)
if i not in remove_keys:
remove_keys.append(i)
for i in remove_keys:
del duplicate[i]
rows = []
removed_index = []
for k in duplicate:
row = tmp_df[tmp_df['index'] == k].iloc[0]
X_min = [row['x_min']]
X_max = [row['x_max']]
Y_min = [row['y_min']]
Y_max = [row['y_max']]
removed_index.append(k)
for i in duplicate[k]:
removed_index.append(i)
row = tmp_df[tmp_df['index'] == i].iloc[0]
X_min.append(row['x_min'])
X_max.append(row['x_max'])
Y_min.append(row['y_min'])
Y_max.append(row['y_max'])
X_min_avg = sum(X_min) / len(X_min)
X_max_avg = sum(X_max) / len(X_max)
Y_min_avg = sum(Y_min) / len(Y_min)
Y_max_avg = sum(Y_max) / len(Y_max)
new_row = [row['image_id'], row['class_name'], row['class_id'], X_min_avg, Y_min_avg, X_max_avg, Y_max_avg, row['width'], row['height']]
rows.append(new_row)
for index, row in tmp_df.iterrows():
if row['index'] not in removed_index:
new_row = [row['image_id'], row['class_name'], row['class_id'], row['x_min'], row['y_min'], row['x_max'], row['y_max'], row['width'], row['height']]
rows.append(new_row)
new_df = pd.DataFrame(rows, columns =['image_id', 'class_name', 'class_id', 'x_min', 'y_min', 'x_max', 'y_max', 'width', 'height'])
return new_df
images_lst = df_train.groupby('image_id').apply(list).reset_index()['image_id'].tolist()
images_dir = '/content/vinbigdata-xray/vinbigdata/train/'
# Add class_id=14 and class_id=15
frames = []
for img_id in images_lst:
sub_df = df_train[df_train['image_id'] == img_id].reset_index()
sub_df = averageCoordinates(sub_df, 0.5)
frames.append(sub_df)
rows = []
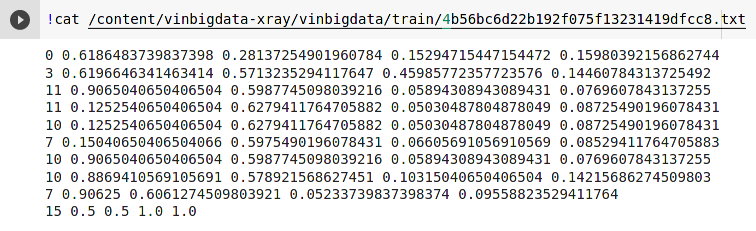
if int(sub_df["class_id"][0]) == 14:
rows.append("14 0.5 0.5 1.0 1.0")
else:
for index, row in sub_df.iterrows():
w = int(row["width"])
h = int(row["height"])
cx = (int(row["x_min"]) + int(row["x_max"])) / 2 / w
cy = (int(row["y_min"]) + int(row["y_max"])) / 2 / h
bw = (int(row["x_max"]) - int(row["x_min"])) / w
bh = (int(row["y_max"]) - int(row["y_min"])) / h
row = [str(row["class_id"]), str(cx), str(cy), str(bw), str(bh)]
rows.append(" ".join(row))
rows.append("15 0.5 0.5 1.0 1.0")
f = open(images_dir + img_id + ".txt", "w")
f.write("\n".join(rows))
f.close()
new_df = pd.concat(frames)
new_df.to_csv('/content/vinbigdata-xray/new_train.csv', index=False)
An example of an abnormalcy image
Split train and valid dataset
import pandas as pd
from sklearn.model_selection import train_test_split

df_train = pd.read_csv('/content/vinbigdata-xray/new_train.csv')
train, val = train_test_split(df_train, test_size=0.2)

train_images_lst = train.groupby('image_id').apply(list).reset_index()['image_id'].tolist()
val_images_lst = val.groupby('image_id').apply(list).reset_index()['image_id'].tolist()


def createImagesTxt(_images, filepath):
    images_dir = '/content/vinbigdata/train/'
    rows = []
    for img_id in _images:
        rows.append(images_dir + img_id + '.jpg')
    f = open(filepath, "w")
    f.write("\n".join(rows))
    f.close()


train_path = '/content/train.txt'
val_path = '/content/val.txt'
createImagesTxt(train_images_lst, train_path)
createImagesTxt(val_images_lst, val_path)
The config.yaml file
!rm -f /content/config.yaml
!echo "train: /content/train.txt" >> /content/config.yaml
!echo "val: /content/val.txt" >> /content/config.yaml
!echo "nc: 16" >> /content/config.yaml
!echo "names: ['Aortic enlargement','Atelectasis','Calcification','Cardiomegaly','Consolidation','ILD','Infiltration','Lung Opacity','Nodule/Mass','Other lesion','Pleural effusion','Pleural thickening','Pneumothorax','Pulmonary fibrosis','No finding','Finding']" >> /content/config.yaml
Install Yolov5 and training
%cd /content
!git clone https://github.com/ultralytics/yolov5.git

%cd /content/yolov5/
!pip install -qr requirements.txt

!python train.py --img 640 --batch 16 --epochs 90 --data /content/config.yaml --weights yolov5x.pt
Result
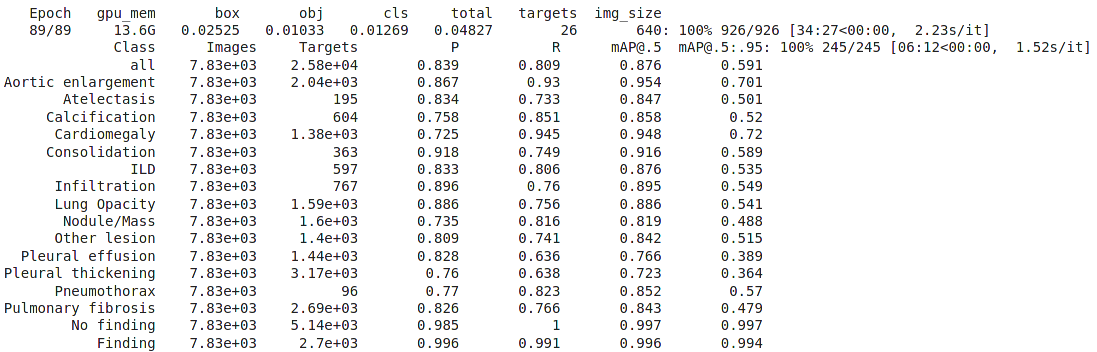
Public score on kaggle: 0.230